 Welcome to Great Falls College MSU

Student Achievement Data Plan
In fall 2018, Great Falls College MSU implemented a new scheduling initiative, the 8-Week Advantage, which split the traditional 16-week semester into two 8-week blocks. The initiative was implemented in stages, beginning with Business, Technology and General Studies (except math and science). In fall 2019, Trades, math and science (except biology) were converted. And in fall 2020, biology courses were converted. The competitive entry Health Sciences programs remain in a 16-week format because of clinical instruction scheduling difficulties. This data plan is intended to monitor student achievement, as well as compare pre-and post-implementation data. The communication plan that follows this document outlines how these data will be shared to the Great Falls College community.
Several assessment opportunities are available, based on the original intent of the initiative, as well as questions that have arisen since implementation. Initially, a survey of faculty and staff was conducted. Comments and responses from those surveys have been incorporated into some of the assessment measures outlined in this document.
Whenever appropriate, data will be disaggregated by age groups, gender, Pell recipients (socio-economic status), single parents, and race/ethnicity to identify possible equity gaps.
Research Question
- Have retention rates increased since the 8-Week Advantage began?
- Full-time
- Part-time
|
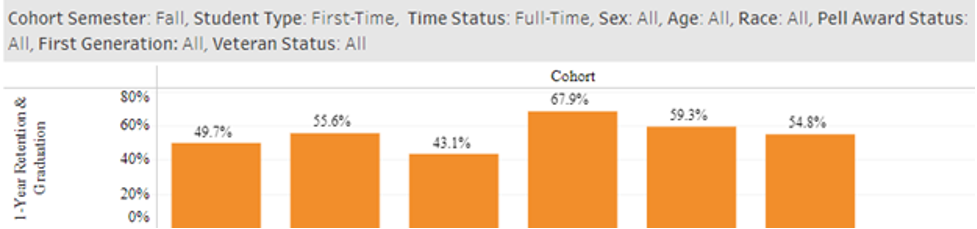
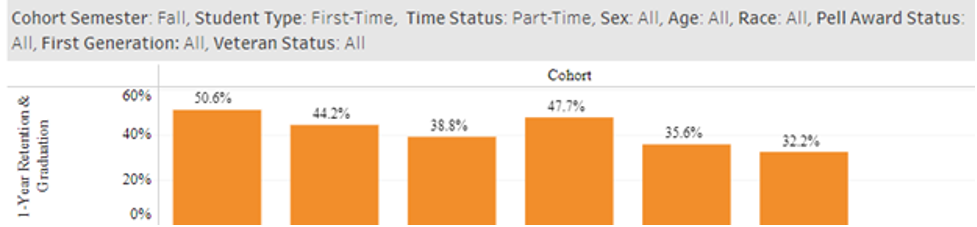
Technical Notes 1a. One-year retention rates of first-time (StuType=N), full-time (12 or more credits), degree-seeking students who began in summer or fall. 1b. One-year retention rate of first-time (StuType=N), part-time (less than 12 credits), degree-seeking students who began in summer or fall. Note that these retention rates are calculated differently than the rates in the 2016-2022 Strategic Plan.
|
Results (updated August 2022):
One-year retention was defined as the proportion of students from the fall cohorts who were enrolled at Great Falls College the subsequent fall semester (after initial enrollment) or had completed a credential.
1a) Among first-time, full-time, degree-seeking students since fall 2015, an initial increase was observed for the fall 2018 cohort of students that was approximately 25% higher than the previous cohort (fall 2017), and 12% higher than the fall 2016 cohort. The fall 2019 and fall 2020 cohorts had retention rates of approximately 59% and 55%, respectively, which were lower than the retention rate of the fall 2018 cohort.
1b) For the first-time, part-time degree-seeking cohort students there was a different trend than with the full-time students. While there was an initial increase in the one-year retention rate from the fall 2018 cohort, the next two cohorts had a lower retention rate than from the three cohorts prior to the 8-Week Advantage, as shown in the graph below.
Research Question
- Have graduation rates increased since the 8-Week Advantage began?
- Full-time cohort
- Part-time cohort
|
Technical notes 1a. 100%, 150%, and 200% graduation rates of first-time (StuType=N, full-time (12 or more credits), degree-seeking students (IPEDS 150% graduation rates disaggregated by race and Pell, Stafford Loan, or neither Pell nor Stafford loan). 1b. 200% graduation rates of degree-seeking first-time (StuType=N), part-time (11 or fewer credits), degree-seeking students.
|
Results (updated October 2022):
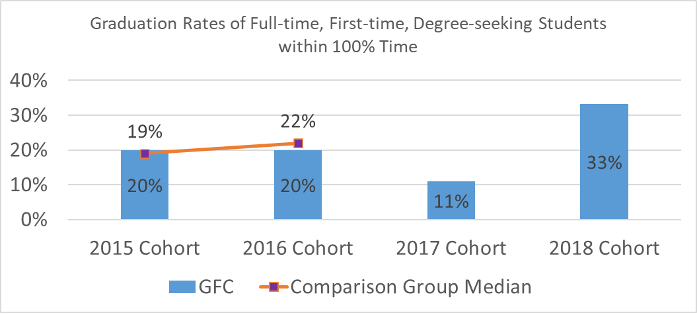
1a) Graduation rates at 100%, 150%, and 200% are reported annually to IPEDS. Beginning with the fall 2015 cohort, these rates were determined based on the total number of credits required for each program (e.g., 100% time of a 2-and-a-half-year program would be two-and-a-half years, 150% would be three-and-a-half years, and 200% would be five years).
The chart below shows the graduation rates within 100% time and includes one cohort since the 8-Week Advantage began (2018 cohort). The orange line represents the median graduation rates of the IPEDS comparison group. The initial observation is that the graduation rates for the pre-8 Week Advantage cohorts were less than for the 2018 cohort. The average graduation rate for the 2008 to 2014 cohorts was approximately 11%, and the median was 10%. For these cohorts, the IPEDS graduation rates were calculated based on the degree type, so all associates were calculated as two-year programs, certificates of applied science were one-year, and certificates of technical studies were half a year.
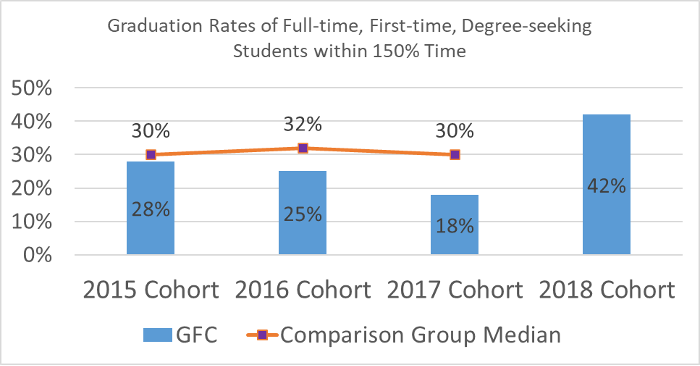
The next chart below shows graduation rates within 150% time, and again we have one post-8 Week Advantage cohort included. We observe that the graduation rate for the 2018 cohort was much higher than the previous three cohorts. The average graduation rate for the 2008 to 2014 cohorts was 18%, and the median was 18%.
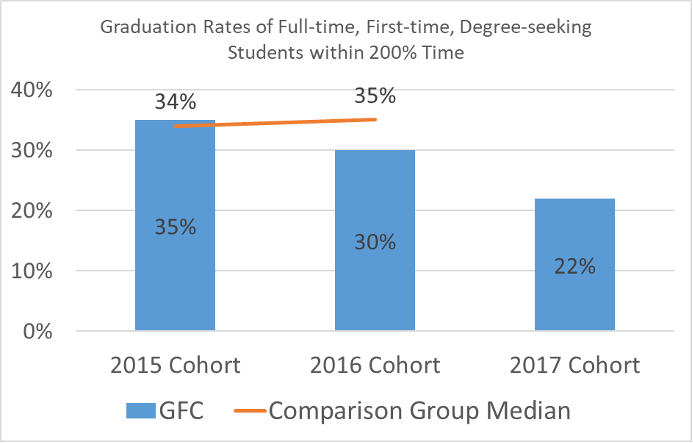
The graduation rates within 200% time do not yet include any cohorts since the 8-Week Advantage began, but the chart below shows the rates for the 2015 to 2017 cohorts. The average graduation rate for the 2008 to 2014 cohorts was 24% and the median was 25%. Once data for the 2018 cohort is available (approximately January 2024) this report will be updated.
More information available on Tableau Server and IPEDS.
1b) Data will be updated in AY 2022-23.
Research Questions
- Has the proportion of students completing a college-level writing course in their first year changed since the 8-Week Advantage?
- Has the proportion of students completing a college-level math course in their first year changed since the 8-Week Advantage?
- In 8-week course enrollments across campus, has the distribution of passing grades changed since the 8-Week Advantage?
- Has the proportion of students on academic probation and suspension changed since the 8-Week Advantage?
|
Technical notes 1. First-time (StuType=N), full-time (12 or more credits) and part-time (11 or fewer credits), degree-seeking students pursuing a program that requires college-level math/writing who complete college-level writing within one year (CCM Pathways and PBF): Disaggregate by writing placement (college-level, developmental education). 2. First-time (StuType=N), full-time (12 or more credits) and part-time (11 or fewer credits), degree-seeking students pursuing a program that requires college-level math/writing who complete college-level math within one year (CCM Pathways and PBF): Disaggregate by math placement (college-level, developmental education). 3. Proportion of course enrollments that result in passing grades: Disaggregate by subject area, modality, part of term, and math and BIOH courses (like M 065, M 090, BIOH 108, etc.) because of student comments from surveys. 4. Disaggregate Registrar’s Office report by 8-week course enrollments and primary program (Major1). |
Results (updated October 2022):
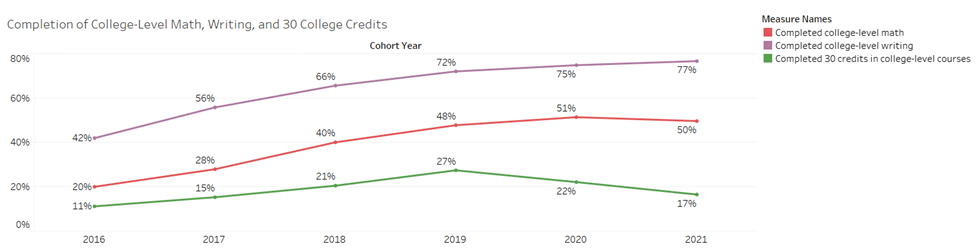
Has the proportion of students completing a college-level writing course in their first year changed since the 8-Week Advantage? Since the 8-Week Advantage began, the proportion of degree-seeking students of the cohort students has increased with each cohort. The 2016 and 2017 cohorts had 42% and 56%, respectively, complete a college-level writing course within their first year. The 2018 through 2021 cohorts had 66%, 72%, 75%, and 77% of students, respectively, complete a college-level writing course within their first year.
College-level placement
When comparing the completion rates of college-level writing amongst those cohort students who placed into developmental writing, the proportion of cohort students who completed a college-level writing before the 8-Week Advantage began were 32% from 2016 and 31% from 2017. After the 8-Week Advantage, these rates were 47% from 2018, 54% from 2019, 74% from 2020, and 64% from 2021.
Developmental education placement
Alternatively, comparing the trend of completion rates of college-level writing amongst those cohort students who placed into college-level writing is only possible with students who began after the 8-Week Advantage. There is only one data point available (2017 cohort) from students who began prior to the 8-Week Advantage; while that proportion of 64% is lower than what we observe post 8-Week Advantage, we are not able to compare the previous trend. However, Since the 8-Week Advantage began the rates have steadily increased with each cohort—72% from the 2018 cohort, 76% from the 2019 cohort, 77% from the 2020 cohort, and 84% from the 2021 cohort completed a college-level writing course within their first year.
More information available on Tableau Server.
- Has the proportion of students completing a college-level math course in their first year changed since the 8-Week Advantage? Of cohort students who first enrolled prior to the 8-Week Advantage, there are only two data points available: data from the 2016 and 2017 cohorts. From the 2016 cohort, 20% completed a college-level math course, compared to 28% of students from the 2017 cohort. Since the 8-Week Advantage, the rates for the 2018 through 2021 cohorts were 40%, 48%, 51%, and 50%, respectively.
College-level placement
Of students who placed into college-level math, 68% of the 2017 cohort, 69% of the 2018 cohort, 9% of the 2019 cohort, 86% of the 2020 cohort, and 75% of the 2021 cohort complete a college-level math course within their first year.
Developmental education placement
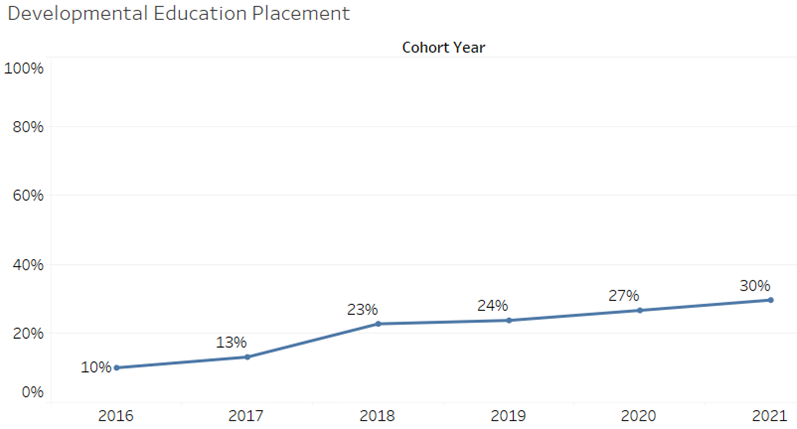
Between the 2016 and 2021 cohorts the rates of students who placed into developmental education math and completed a college-level math course increased from 10% to 30%. The largest increase was seen between the 2017 and 2018 cohorts; 13% in 2017 compared to 23% in 2018.
More information available on Tableau Server.
Research questions
- What changes have occurred in the number of courses and credits that students enroll in each semester since the 8-Week Advantage?
- Has the proportion of students completing health science program prerequisites within their first year changed since the 8-Week Advantage?
- a) Full-time cohort within one year
- b) Part-time cohort within two years
|
Technical notes 1. Measures of central tendency (mean, median, and mode) of the number of courses and credits students (degree-seeking and non-degree seeking) take each semester (Enroll_CreditHours report): Disaggregate by first 8-weeks, second 8-weeks; student type; division and primary program (Major1). 2. First-time (StuType=N), full-time (12 or more credits) and part-time (11 or fewer credits), degree-seeking students pursuing a pre-health science program.
|
Research questions
- What support have faculty and staff used in transitioning to the 8-Week Advantage?
- What has worked well (best practices showcase)?
- What have been challenges?
|
Technical Notes 1, 2, and 3. Qualitative data: Gather this information from faculty and staff comments, meeting minutes, email communication, previous faculty and staff surveys, etc. |
Communication Plan
The college will communicate changes that are under consideration, and why, before decisions are made so stakeholders can be involved in the conversation.
Once decisions are made, those decisions will be communicated widely, along with the underlying reasons for those decisions.
Decisions should be documented in a consistent manner and posted in a consistent format and location to be accessible throughout campus to facilitate understanding, as well as help in reconstructing these processes for formal reports-- such as accreditation, presentation to external bodies, etc.
- Web site
The following information will be posted publicly on the college website:
- Data plan
- Full results
- Form for submitting comments
- Your Advantage newsletter
Regular feature, highlighting a single result and explanation with link to full results on web site.
- Campus news releases
Work with communications and marketing director to highlight noteworthy results.
- Annual forum for faculty and staff
During an in-person, annual forum the Executive Team will highlight results, gather feedback, and encourage campus discussion of the results.
- Annual report to student government, other student groups
Presentation of highlights at a student government meeting and to other available student groups. The presentation will include a discussion of comments and resulting actions.